Cohort and Retention Intelligence Without an Analytics Engineer
Client: Mid-market e-commerce operator · Scale: Multi-channel acquisition, subscription and one-time purchase mix
Multi-channel e-commerce, weekly live cohort refresh, zero data engineering tickets.
CLIENT PROBLEM
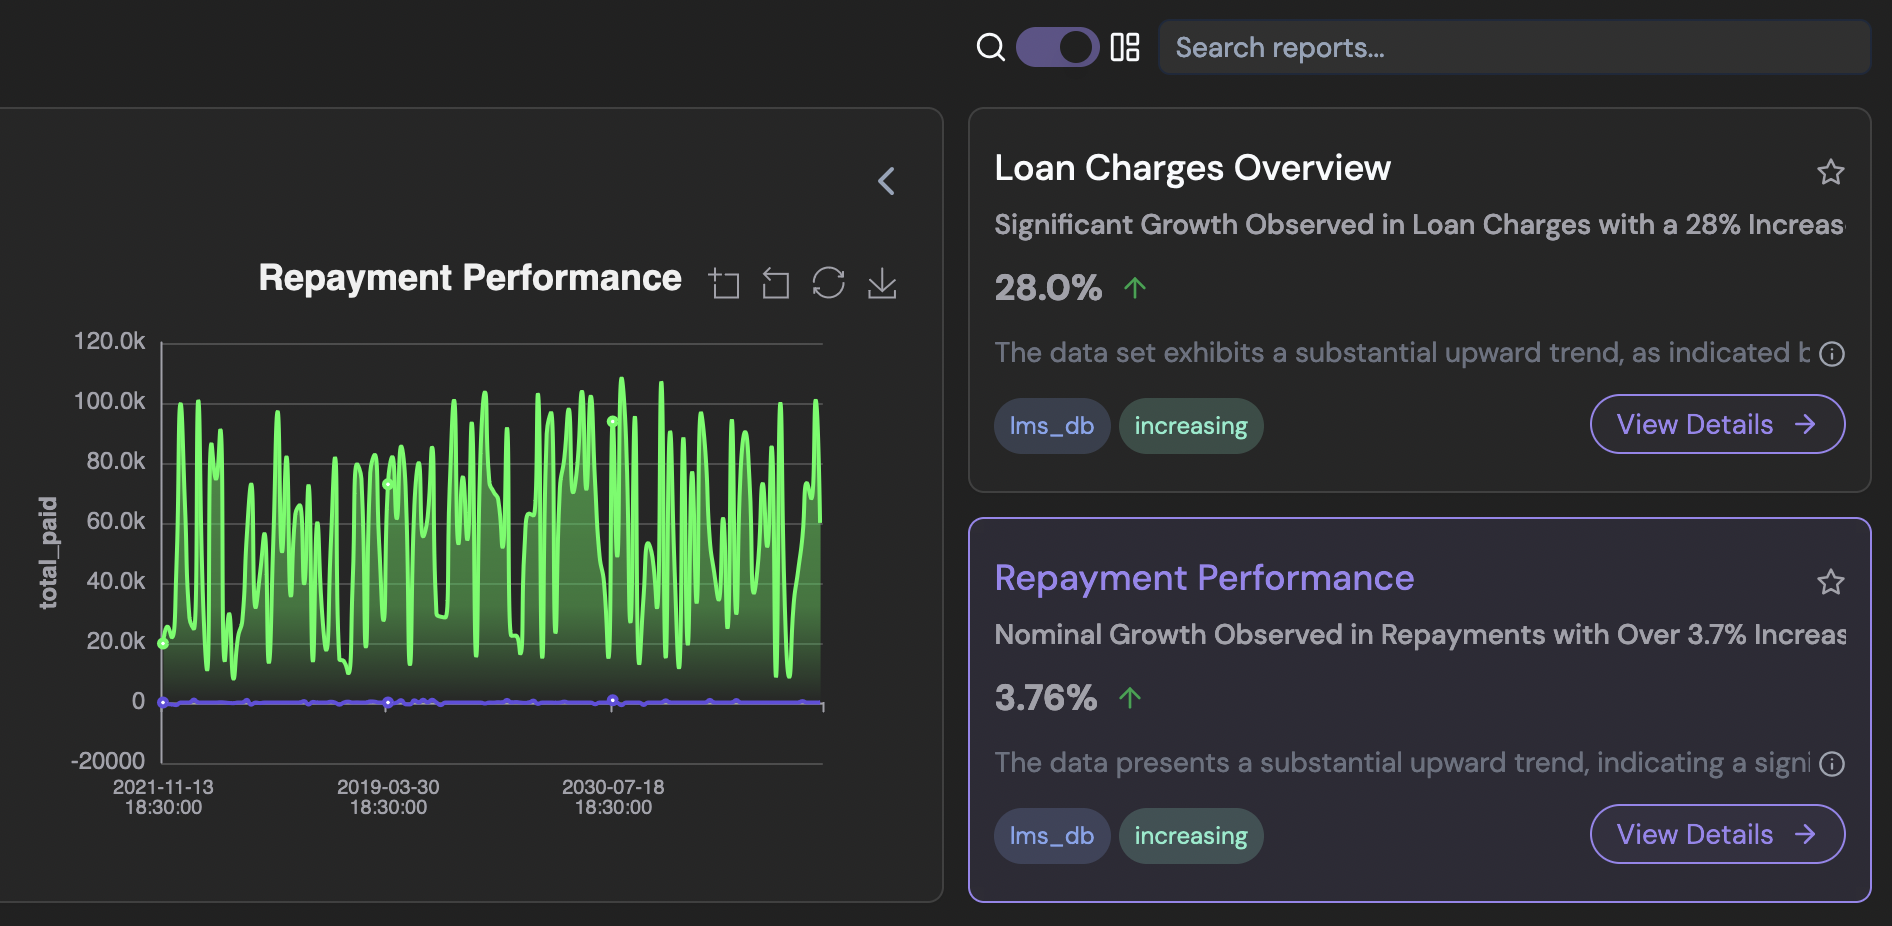
A mid-market e-commerce operator had transactional data in their database, customer attribute and acquisition data in a marketing platform export, and subscription/renewal event data in a separate system. The growth team needed weekly cohort retention rates, revenue-at-risk from churning segments, and acquisition channel attribution — all cross-source. The analytics engineering backlog meant these reports were built once and never maintained. Decisions on acquisition budget allocation were being made from data that was 30–60 days stale.
OUR SOLUTION & ARCHITECTURE
Connected to all three sources. The Knowledge Base was configured with cohort definitions, retention window rules, revenue attribution logic, and churn threshold definitions — written in plain English by the growth lead, validated against the schema by Autonmis. A multi-step pipeline ran weekly: source refresh, cohort construction, retention calculation, revenue-at-risk roll-up, dashboard publish. The growth lead could ask Autonmis "which acquisition channel has the worst 90-day retention in the last three cohorts?" and receive a grounded, SQL-executed answer with the underlying data visible and auditable. No ticket to data engineering. No waiting for the next sprint.
SYSTEM TOPOLOGY
Orders & Returns
Storefront webhooks
Payment Settlement
Gateway & COD sync
Cohort Engine
Repeat & LTV SQL
Churn Watchdog
Margin drop alerts
Operator Digest
Morning cohort summary
WHY IT MATTERS & SYSTEM MECHANICS
- Trigger
- Weekly pipeline run, plus on-demand query from the growth lead at any time.
- Sources
- Transactional database · Marketing platform export (acquisition/attribution) · Subscription system (renewal/churn events)
- Human Loop
- Growth lead defines and validates cohort, retention-window, and churn-threshold rules directly in the Knowledge Base — no engineering ticket — and reviews revenue-at-risk alerts before reallocating acquisition budget.
- Retention math required three systems that never lined up.
- Transactions, acquisition and attribution data, and subscription events lived in three places with no shared pipeline connecting them.
- Reports were built once and abandoned.
- Each cross-source question competed with the analytics engineering backlog — by the time a report shipped, the business question behind it had usually already shifted.
BENEFITS REALISED
- 30–60 days stale → weekly refresh
Data freshness for retention analysis
Same-day refresh available on demand
- Zero
Engineering tickets required after initial setup
Growth lead runs queries and pipeline independently
- Live from week 3
Growth team self-serve query capability
Cross-source questions answered with auditable SQL
- 22 days
Time to first live cohort dashboard
From disconnected sources to production intelligence
- Eliminated
Decisions made from stale data
Acquisition budget now allocated on current cohort data
The growth lead's cohort and churn definitions live in the Knowledge Base, not in one analyst's spreadsheet formulas — so 'which channel has the worst 90-day retention' gets the same validated answer whether it's asked in week one or week twenty.
DEPLOY ON YOUR INFRASTRUCTURE
Scope a 14-day pilot on your production exports.
Read-only connections, deterministic rules, and a working system in under three weeks.
MORE CLIENT BUILDS
Explore other deployments
Collections Exception Intelligence
A mid-market NBFC eliminated 90 minutes of daily manual reconciliation and reduced exception discovery lag from 14 hours to under 2 minutes.
Campaign ROI Intelligence for Multi-Location Operators
A large franchise operator replaced weekly manual campaign reporting with a live cross-source dashboard — from raw sources to executive brief in 21 days.
Automated Quality Governance for AI Training Data
A voice data operation replaced manual QC review with a 7-stage automated evaluation pipeline — routing 11 submissions per evaluator-hour, with full audit provenance for every decision.
Composite deployment example. The workflow architecture reflects real production implementations; client names are anonymized under NDA.