Campaign ROI Intelligence for Multi-Location Operators
Client: Multi-location QSR/retail franchise operator · Scale: City-wide promotional campaign, multi-store network
City-wide campaign, same-day visibility, zero engineering after setup.
CLIENT PROBLEM
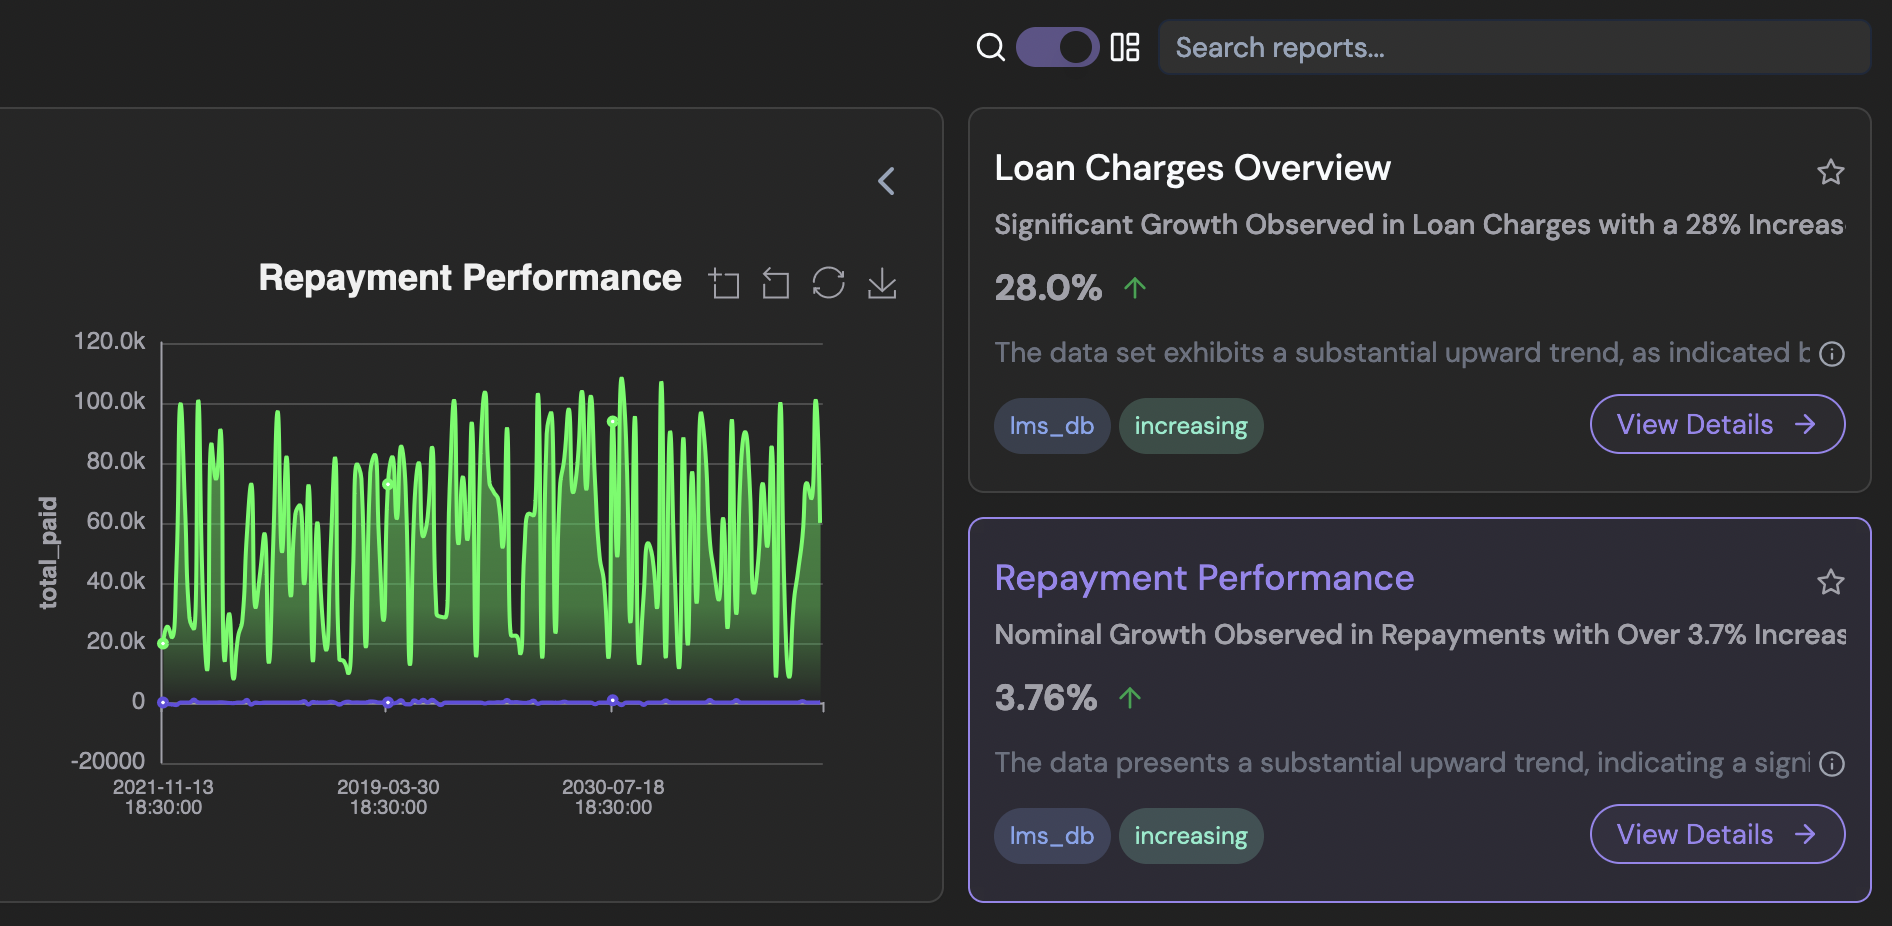
A franchise operator running a city-wide promotional campaign had spend data in Google Ads and Meta Ads, payment gateway splits in their operational database, and store-level sales data in a data warehouse. The exec team wanted live visibility on coupon redemption by store, campaign ROAS by channel, and underperforming store identification — updated as the campaign ran. What they had was a weekly spreadsheet assembled manually by two analysts, usually ready by Tuesday for the previous week. By the time an underperforming store was identified, the campaign window was nearly closed.
OUR SOLUTION & ARCHITECTURE
Connected to all three sources. The Knowledge Base was configured with campaign definitions, ROAS calculation rules, store region mappings, and underperformance thresholds. Autonmis built a multi-step pipeline — source ingestion, transformation, mart build, dashboard refresh — governed under a DAG where each step only executed when its upstream dependencies completed successfully. The campaign dashboard updated continuously. When a store's redemption rate dropped 20% below the regional average, a Slack alert fired to the ops lead. The CRO could ask "why did Noida drop last Thursday?" and receive a structured, data-grounded answer without opening a notebook.
SYSTEM TOPOLOGY
Store POS & ERP
Sales & SKU stock
Ad Spend Feeds
Meta · Google · CRM
Attribution SQL
Net-margin rollup
Stockout Guard
Live threshold flags
Daily ROI Brief
Store & growth leads
WHY IT MATTERS & SYSTEM MECHANICS
- Trigger
- A store's coupon redemption rate drops 20% below the regional average while a campaign is live.
- Sources
- Google Ads · Meta Ads · Payment gateway database (redemption/splits) · Sales data warehouse (store-level)
- Human Loop
- Ops lead reviews store-performance alerts and decides whether to reallocate budget or pause a store's campaign; the platform surfaces the signal, it doesn't move spend on its own.
- Spend, redemption, and sales lived in three places.
- Google Ads and Meta Ads held spend, the payment gateway held redemption and transaction splits, the warehouse held store-level sales — none of it built to be queried together.
- The only view was a weekly spreadsheet.
- Two analysts assembled it by hand, usually ready the following Tuesday — for the previous week's numbers.
BENEFITS REALISED
- 7 days → same-day
Campaign visibility lag
Dashboard updates continuously as campaign runs
- End of week → within hours
Underperforming store detection
Fires when store drops 20% below regional average
- Eliminated
Weekly analyst reporting hours
Two analysts freed from manual spreadsheet assembly
- Without raising a ticket
Executive self-serve questions answered
CRO queries answered with grounded SQL-executed data
- 21 days
Time from sources connected to live dashboard
From raw exports to production campaign intelligence
Every ROAS and underperformance number here runs against the campaign and region definitions the ops team set in the Knowledge Base — the CRO's ad-hoc questions get the same grounded answer a scheduled dashboard does, with the SQL visible on request.
DEPLOY ON YOUR INFRASTRUCTURE
Scope a 14-day pilot on your production exports.
Read-only connections, deterministic rules, and a working system in under three weeks.
MORE CLIENT BUILDS
Explore other deployments
Collections Exception Intelligence
A mid-market NBFC eliminated 90 minutes of daily manual reconciliation and reduced exception discovery lag from 14 hours to under 2 minutes.
Automated Quality Governance for AI Training Data
A voice data operation replaced manual QC review with a 7-stage automated evaluation pipeline — routing 11 submissions per evaluator-hour, with full audit provenance for every decision.
Clinical Operations Exception Monitoring
A healthcare operations team reduced SLA breach detection from T+48 hours to T+2 hours — without a single engineering sprint after initial setup.
Composite deployment example. The workflow architecture reflects real production implementations; client names are anonymized under NDA.